条形图
条形图或条形图是表示数据类别的图形,矩形条的长度和高度与其表示的值成比例。条形图可以水平或垂直绘制。条形图描述离散类别之间的比较。图中的一个轴表示被比较的特定类别,而另一个轴表示与这些类别对应的测量值
from matplotlib import pyplot as plt

x = [5, 2, 9, 4, 7]
y = [10, 5, 8, 4, 2]

plt.bar(x, y)

plt.show()

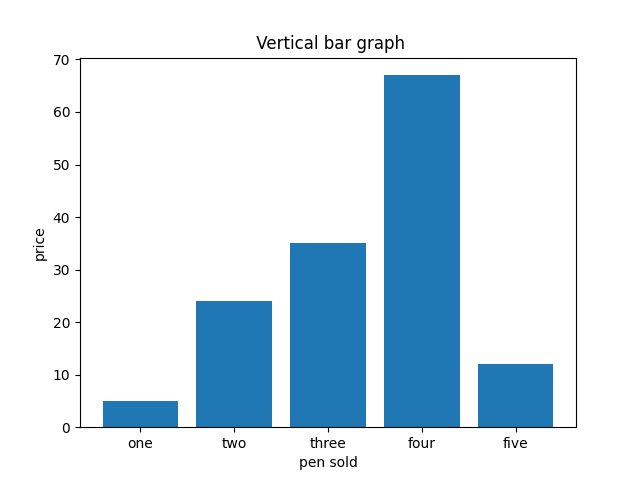
水平和竖直画条形图
plt.bar用于竖直的条形图。
import matplotlib.pyplot as plt

x=['one', 'two', 'three', 'four', 'five']
y=[5, 24, 35, 67, 12]

plt.bar(x, y)

plt.xlabel("pen sold")
plt.ylabel("price")
plt.title(" Vertical bar graph")
plt.show()
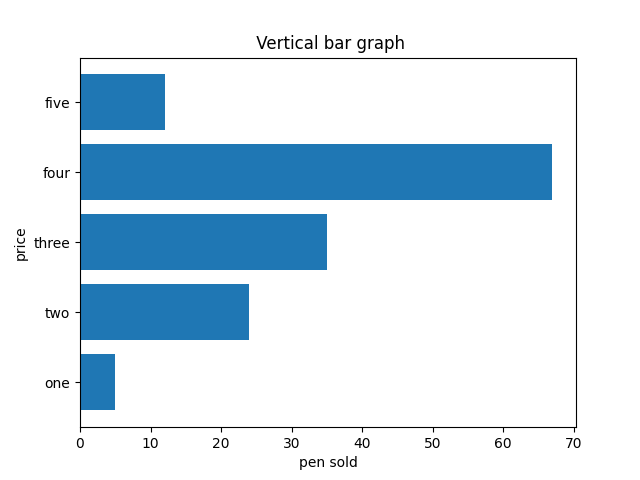
plt.barh用于水平的条形图。
import matplotlib.pyplot as plt

x=['one', 'two', 'three', 'four', 'five']
y=[5, 24, 35, 67, 12]

plt.barh(x, y)

plt.xlabel("pen sold")
plt.ylabel("price")
plt.title(" Vertical bar graph")
plt.show()
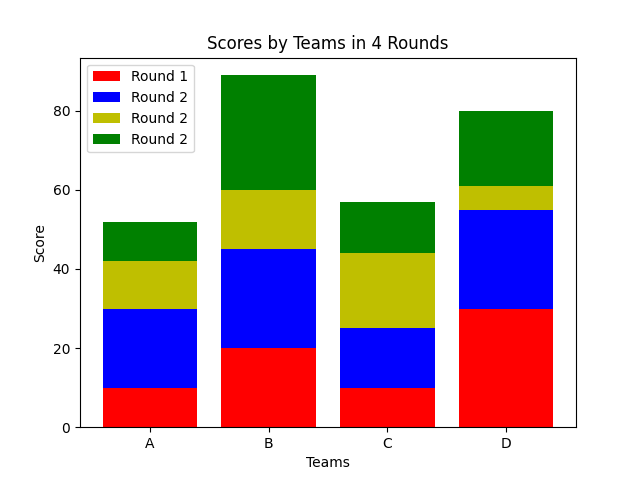
条形堆积图
import matplotlib.pyplot as plt
import numpy as np

x = ['A', 'B', 'C', 'D']
y1 = np.array([10, 20, 10, 30])
y2 = np.array([20, 25, 15, 25])
y3 = np.array([12, 15, 19, 6])
y4 = np.array([10, 29, 13, 19])

plt.bar(x, y1, color='r', label="Round 1")
plt.bar(x, y2, bottom=y1, color='b', label="Round 2")
plt.bar(x, y3, bottom=y1+y2, color='y', label="Round 2")
plt.bar(x, y4, bottom=y1+y2+y3, color='g', label="Round 2")

plt.xlabel("Teams")
plt.ylabel("Score")
plt.legend()
plt.title("Scores by Teams in 4 Rounds")
plt.show()
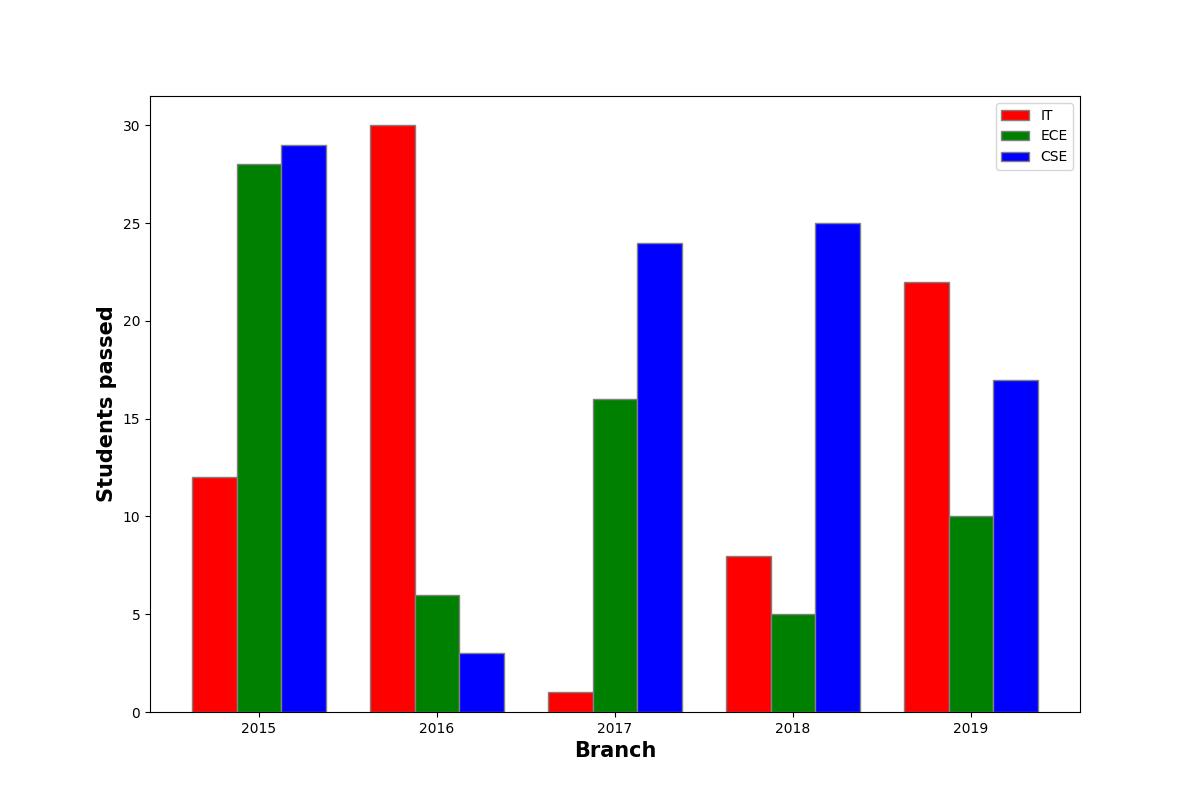
多个条形图
import matplotlib.pyplot as plt
import numpy as np

# set width of bar
barWidth = 0.25
fig = plt.subplots(figsize =(12, 8))

# set height of bar
IT = [12, 30, 1, 8, 22]
ECE = [28, 6, 16, 5, 10]
CSE = [29, 3, 24, 25, 17]

# Set position of bar on X axis
br1 = np.arange(len(IT))
br2 = [x + barWidth for x in br1]
br3 = [x + barWidth for x in br2]

# Make the plot
plt.bar(br1, IT, color ='r', width = barWidth,
        edgecolor ='grey', label ='IT')
plt.bar(br2, ECE, color ='g', width = barWidth,
        edgecolor ='grey', label ='ECE')
plt.bar(br3, CSE, color ='b', width = barWidth,
        edgecolor ='grey', label ='CSE')

# Adding Xticks
plt.xlabel('Branch', fontweight ='bold', fontsize = 15)
plt.ylabel('Students passed', fontweight ='bold', fontsize = 15)
plt.xticks([r + barWidth for r in range(len(IT))],
        ['2015', '2016', '2017', '2018', '2019'])

plt.legend()
plt.show()